


I was inspired by the “Show & Inspire” session this morning! Someone mentioned they were pulling the odata usage statistic into Power Bi to do some analytics and I realized that I had not done that.
It is a bit confusing as there are a large number of rows and columns in the CompanyTrackingData piece so I wanted to share how I got my metrics in case it is helpful to others (or in case someone at ClickLearn wants to tell me I am doing it wrong)
- Page View Counts: Action=pageview
- Video Counts (ShowMe, TryMe, and TestMe): Action=init
- Feedback: Action=feedback
- TryMe Correct Clicks: Action=Correct
- TryMe Incorrect Clicks: Action=Wrong
- Active Users: Distinct Count of User
- Books in Use: Distinct Count of Bookid
- Training/Recordings in use: Distinct Count of Recordingid
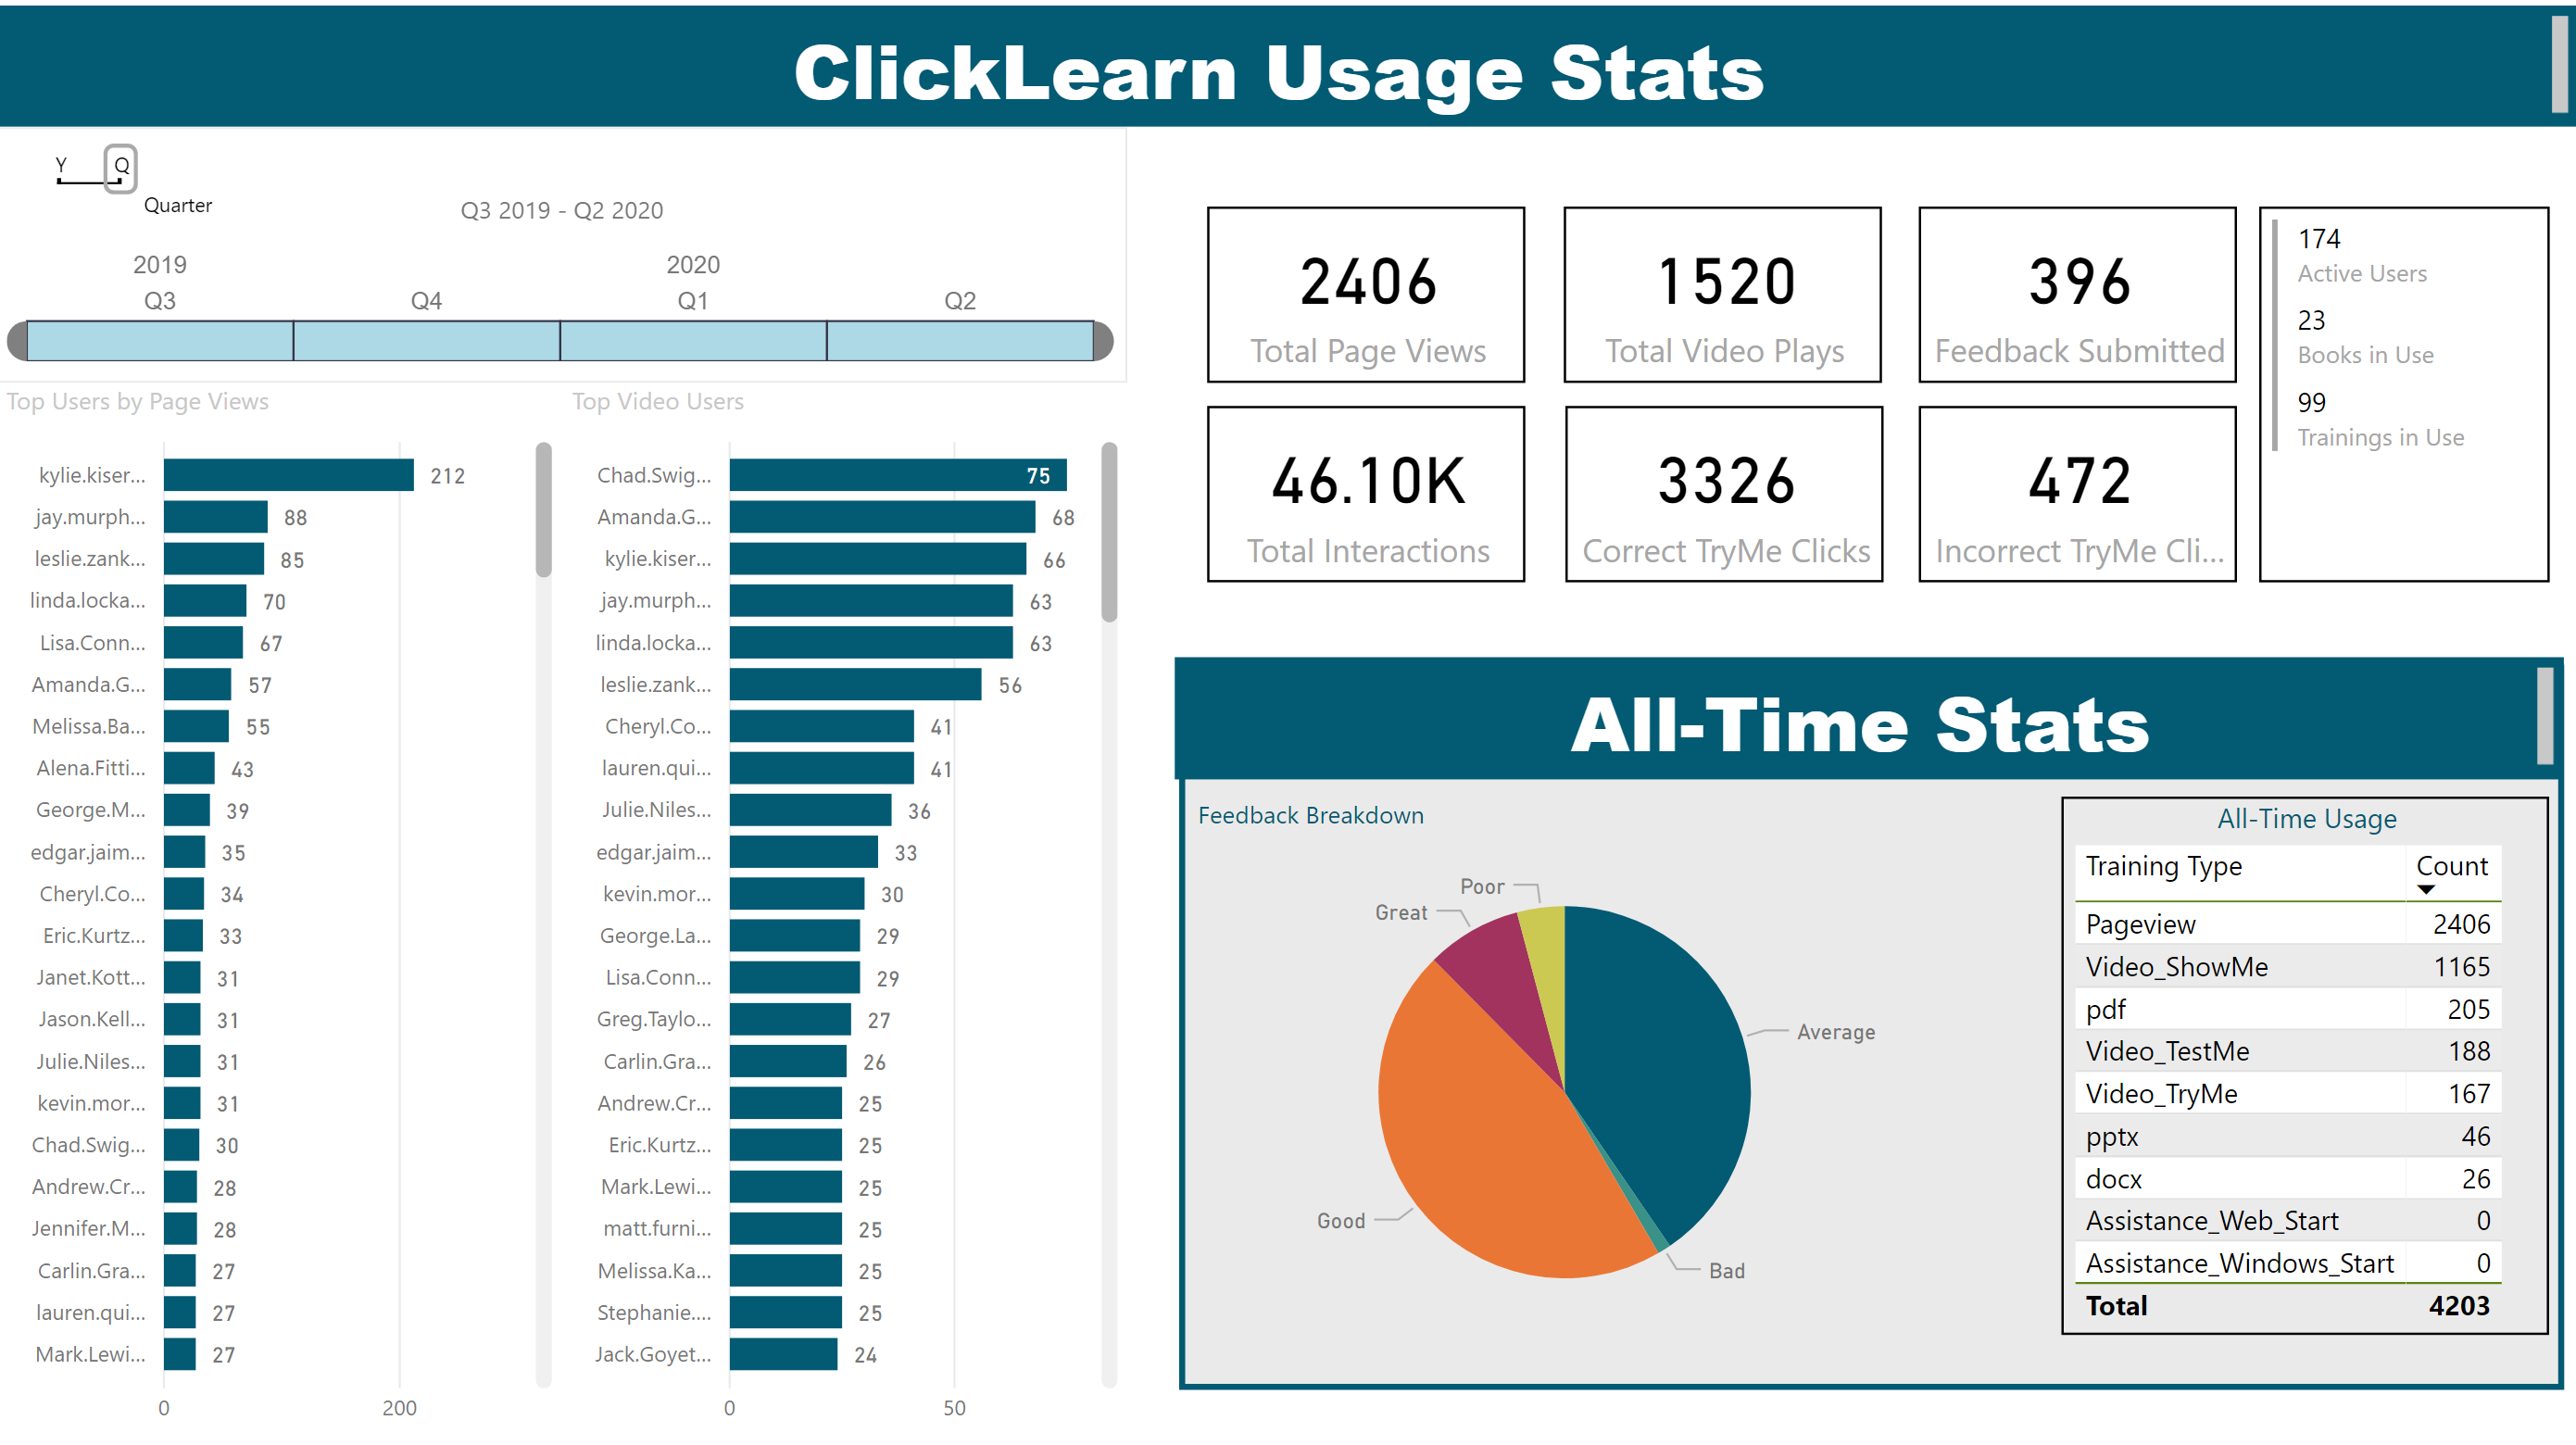
I included the slider bar to filter the data by date to make it a bit more digestible. Plus included the total interactions (count of all rows in the CompanyTrackingData file) because it is impressive!
Here is what the dashboard currently looks like. Still some room for improvement but definitely a step in the right direction!
PS Here is the documentation on using the odata to get this user tracking data. The steps for Excel are very similar to Power BI.