
Depending on platform & license configuration, ClickLearn can support a wide range of deployment scenarios, or setups. Each setup determines where your content is published, what content is published, and how it is presented to the learners. Available data for learning analytics may also be impacted by this.
If you are totally new to learning analytics, you might want to read this short article first:
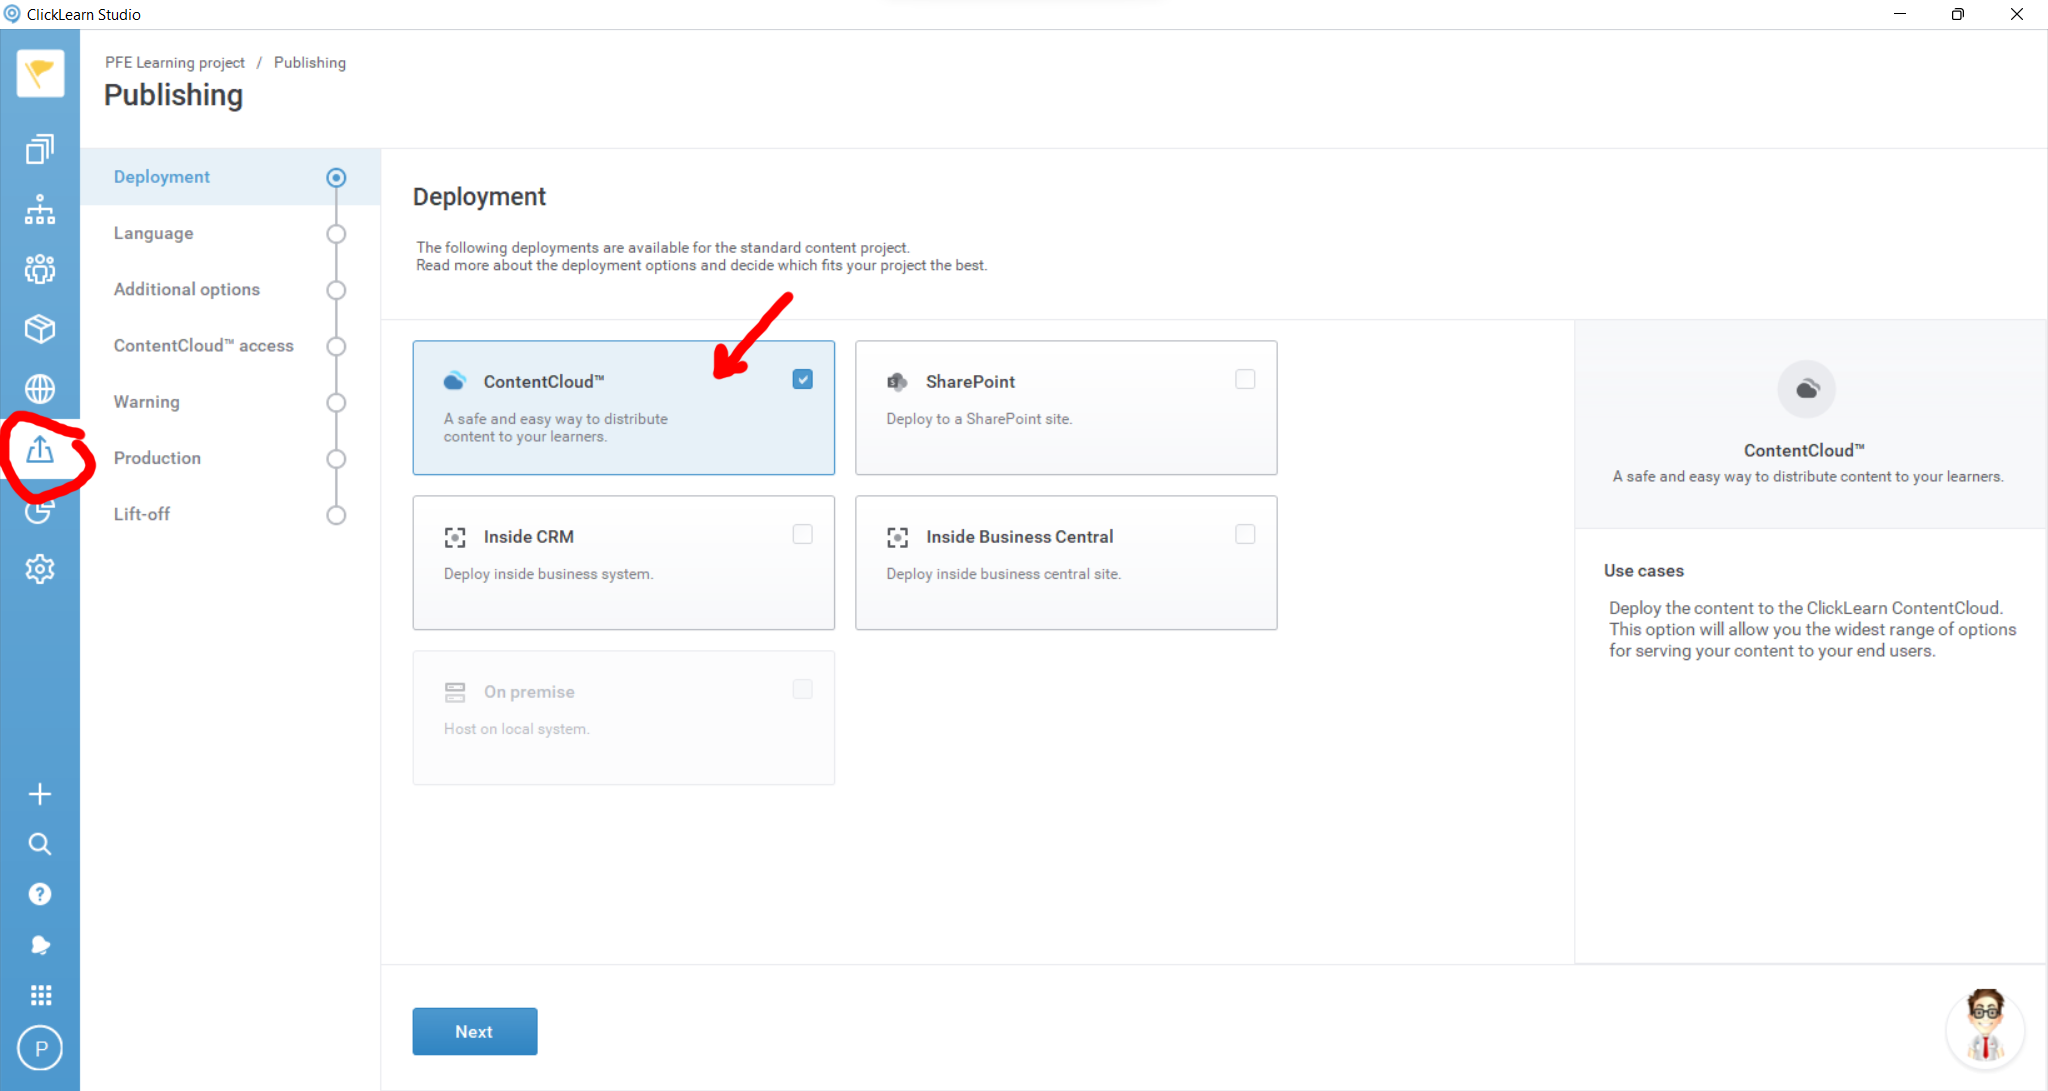
This article covers content published to ContentCloud.
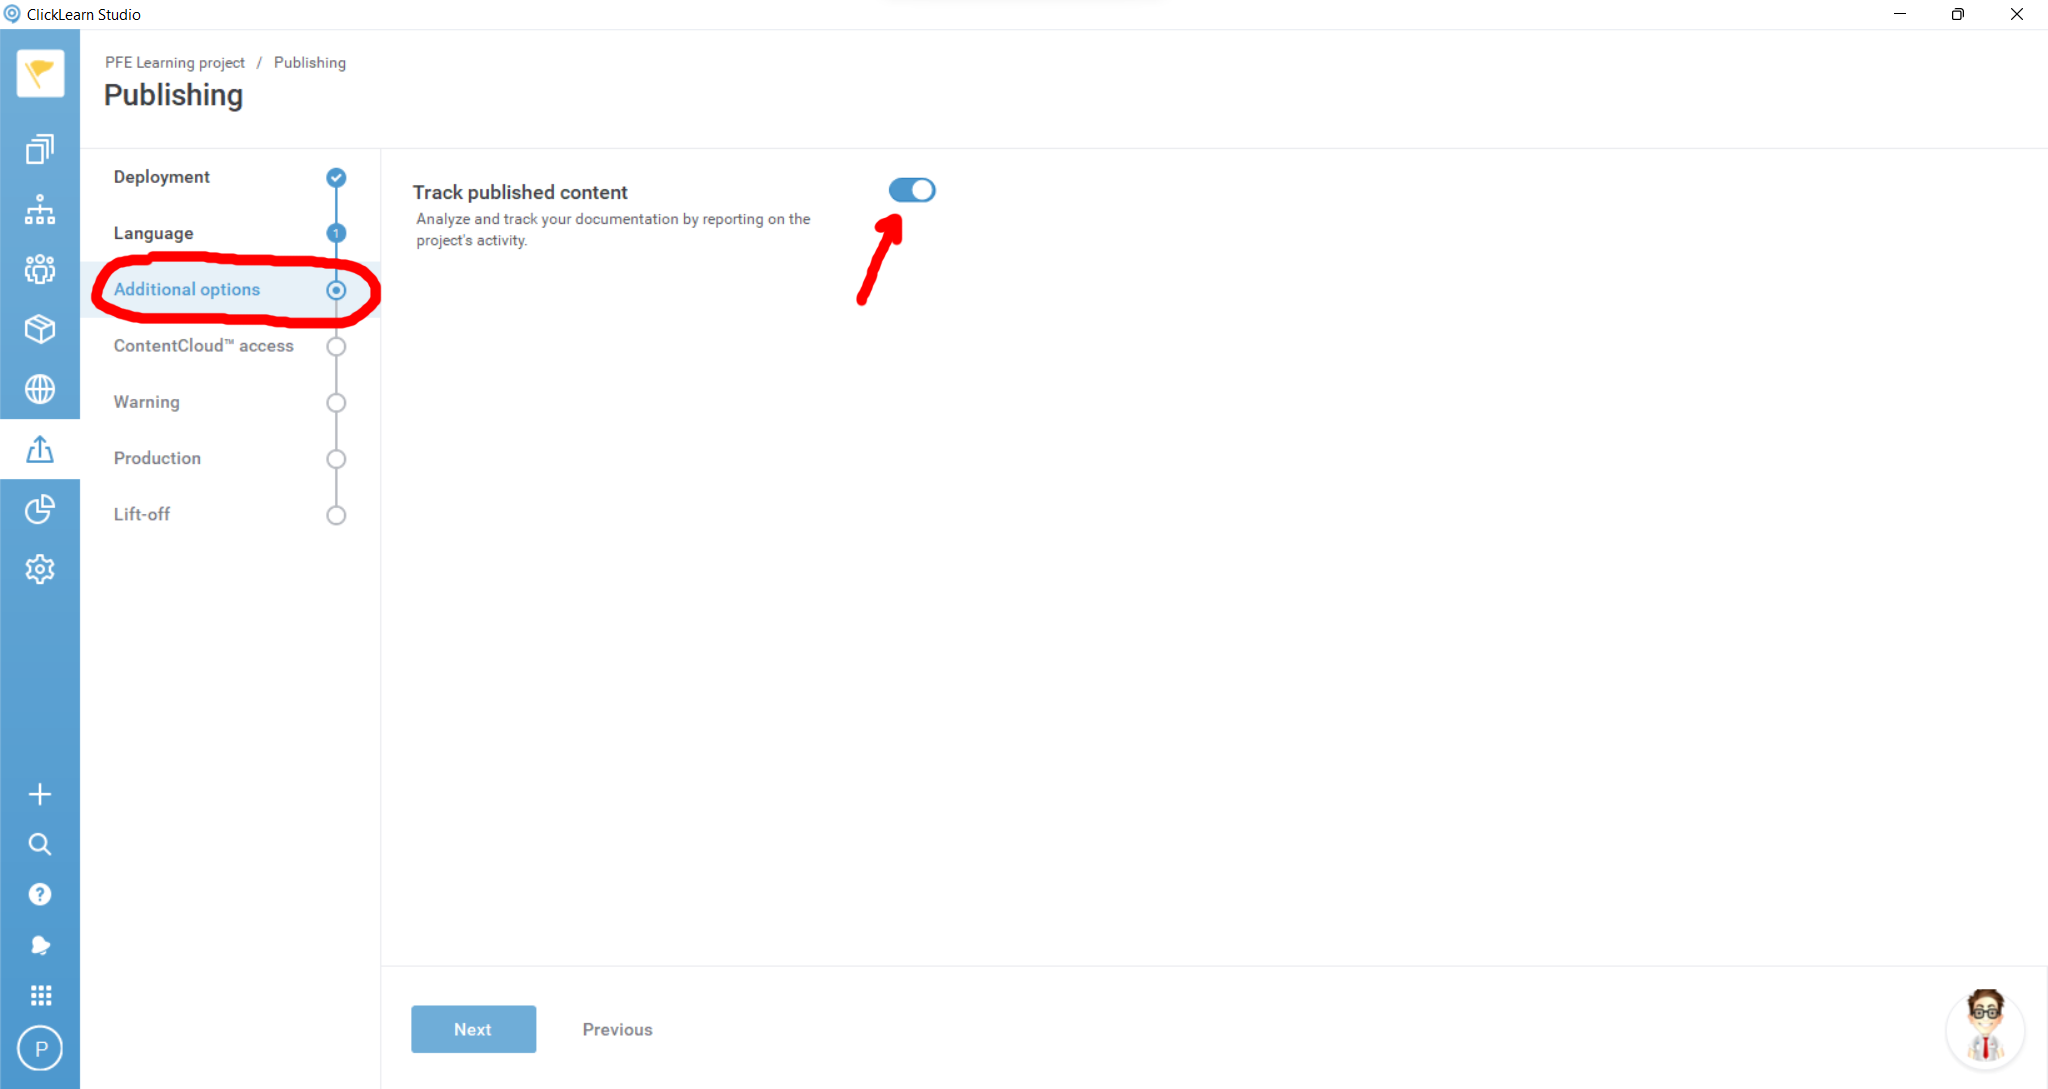
Track published content must be enabled
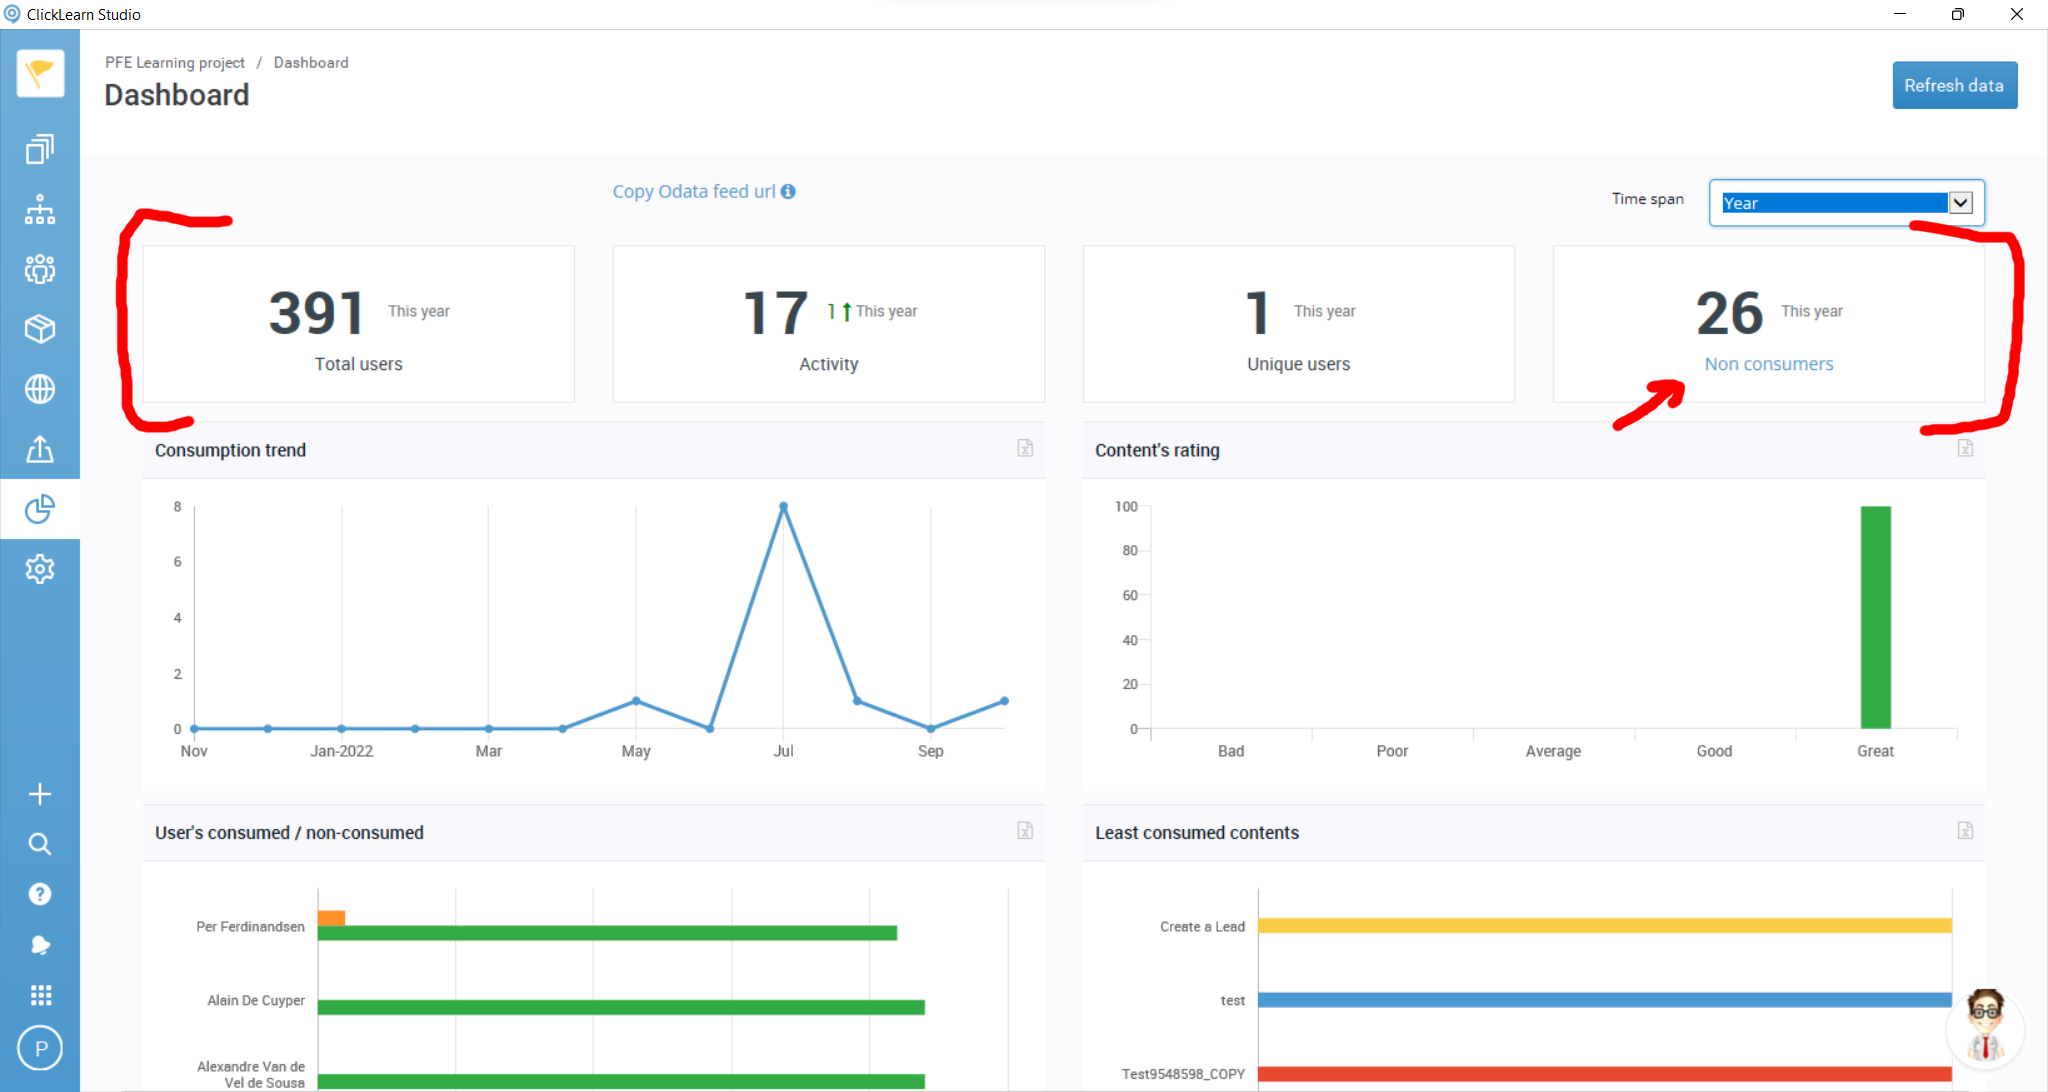
Use your browser and browse your published content, write a few ratings, and then go to Dashboard in Attain to view the data collected. Use Time span selector to narrow or widen time span. Use refresh data to manually refresh data collected to the dashboard.
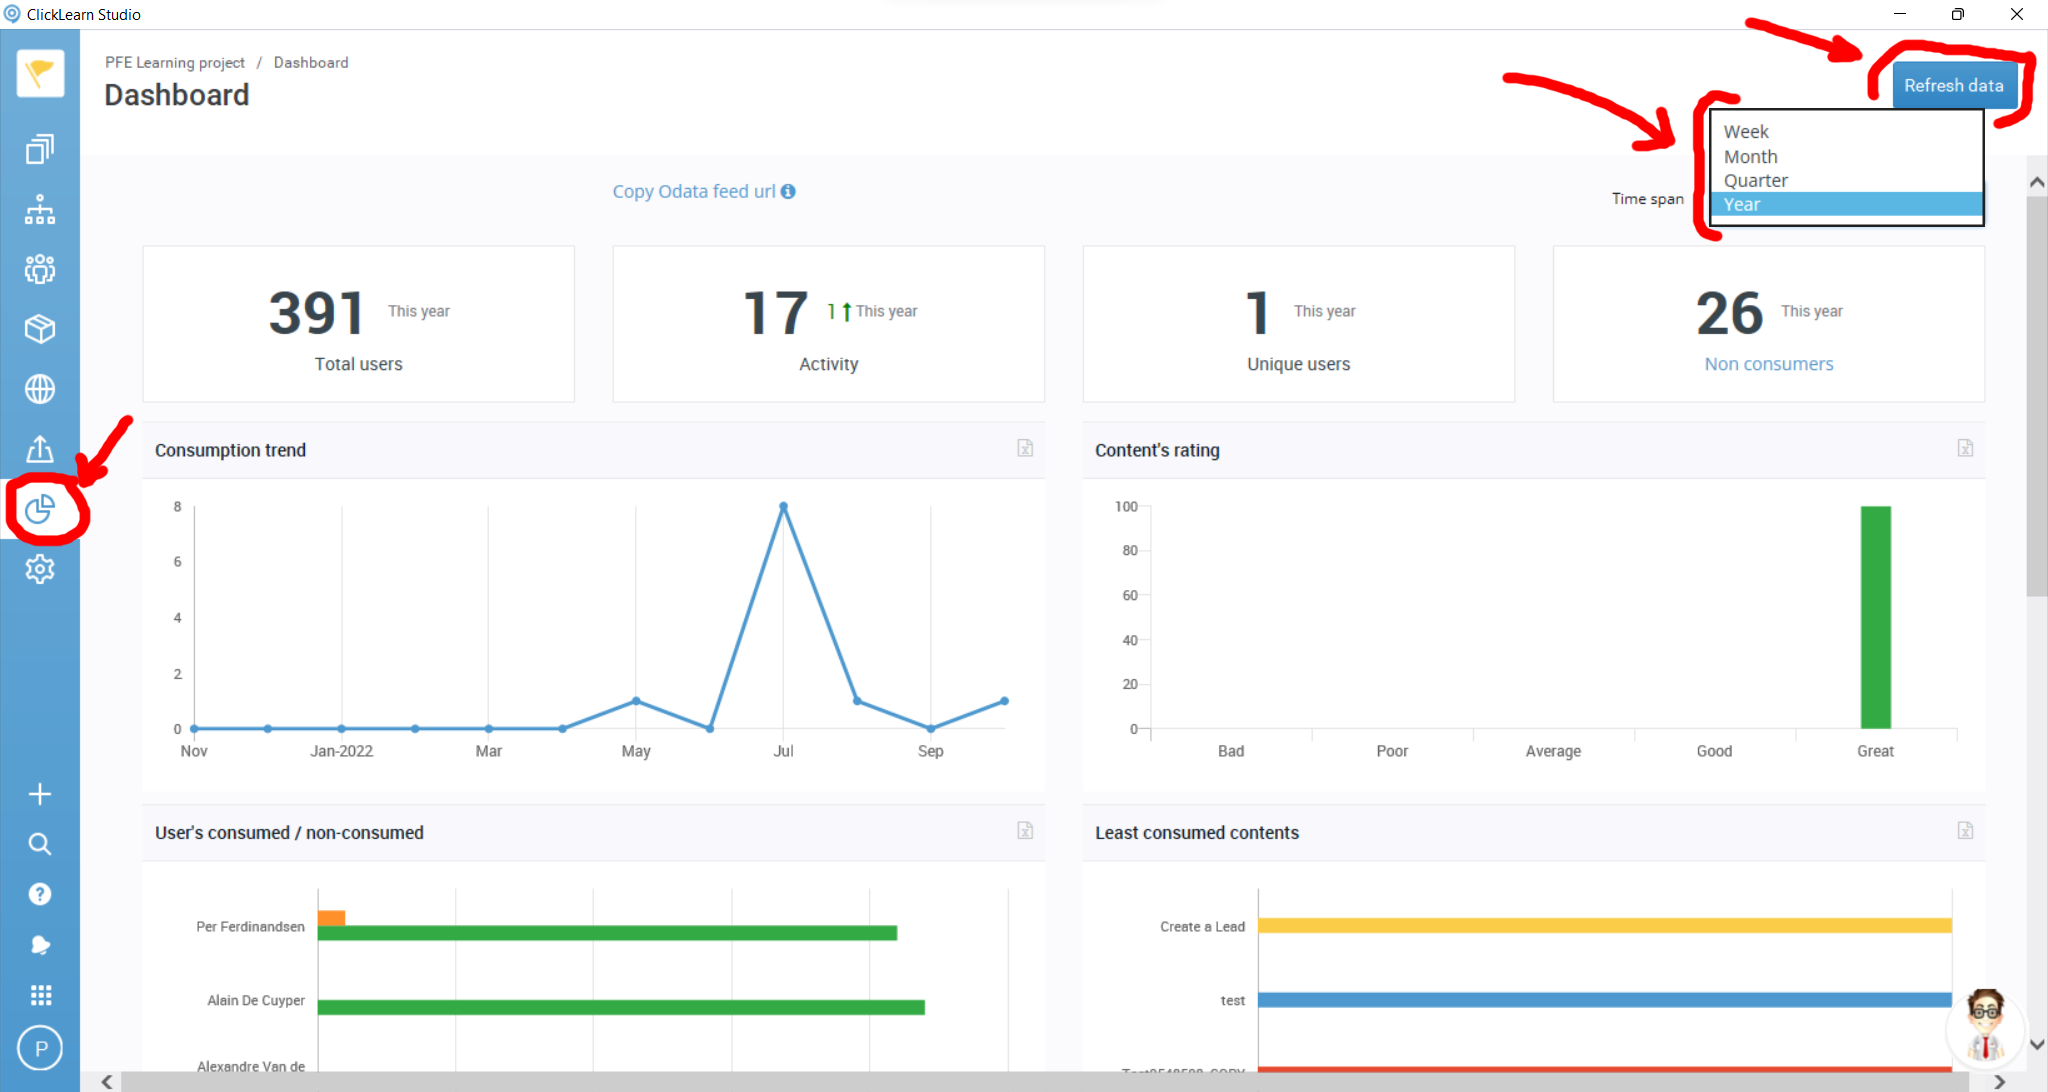
Total users = Total Active Content users (regardless of timespan and project filteration)
Activity = Count of view content in timespan
Unique Users = Count of unique users who view the content in timespan
Non Consumers = Count of unique users who DID NOT view the content in timespan (click to see list)
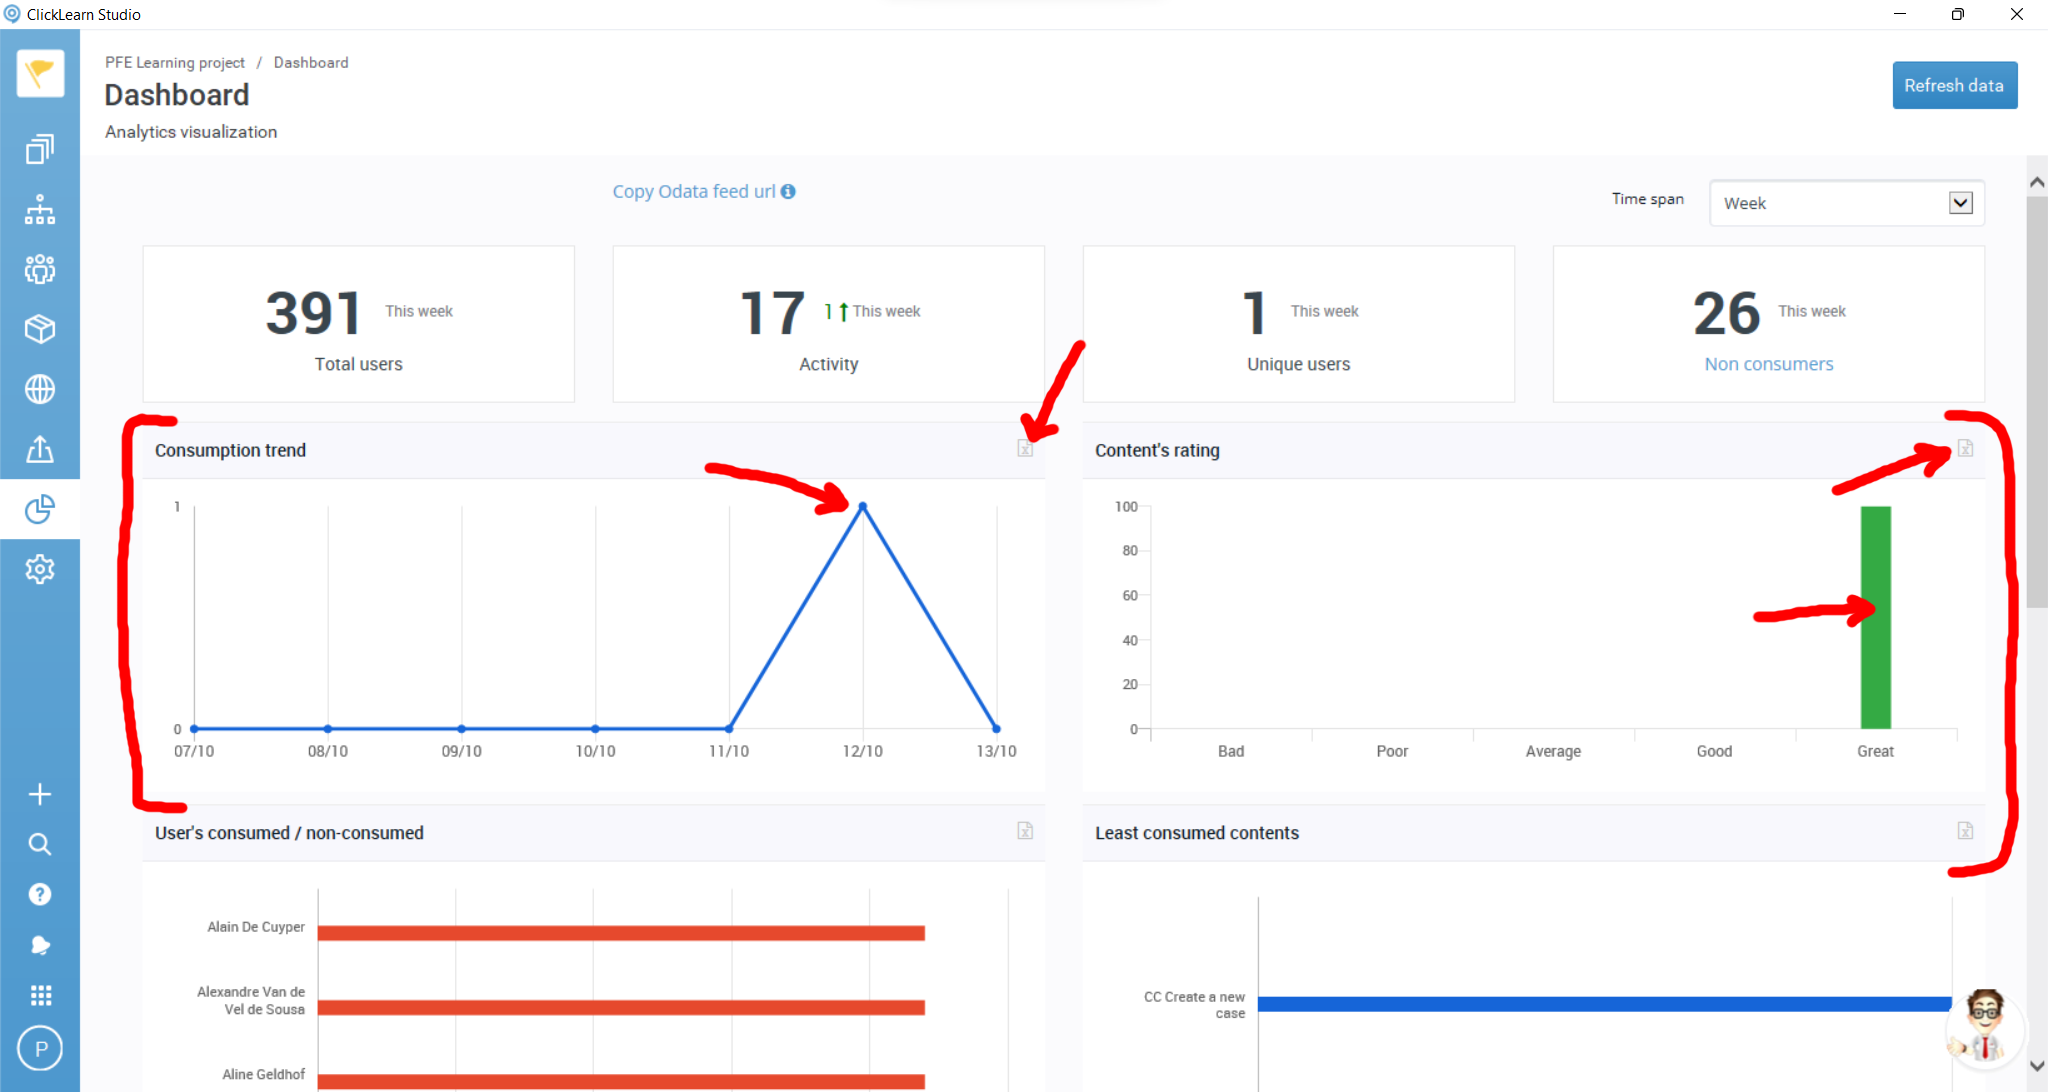
Consumption trend = Content consumption over time span selected.
Click on excel icon to download csv file with data.
Click on trend line value points to see details (wait a few seconds for page to load).
Content’s raing = Ratings collected on content HTML pages (if this is not disabled in template).
Click on excel icon to download csv file with data.
Click on trend line value points to see details (wait a few seconds for page to load).
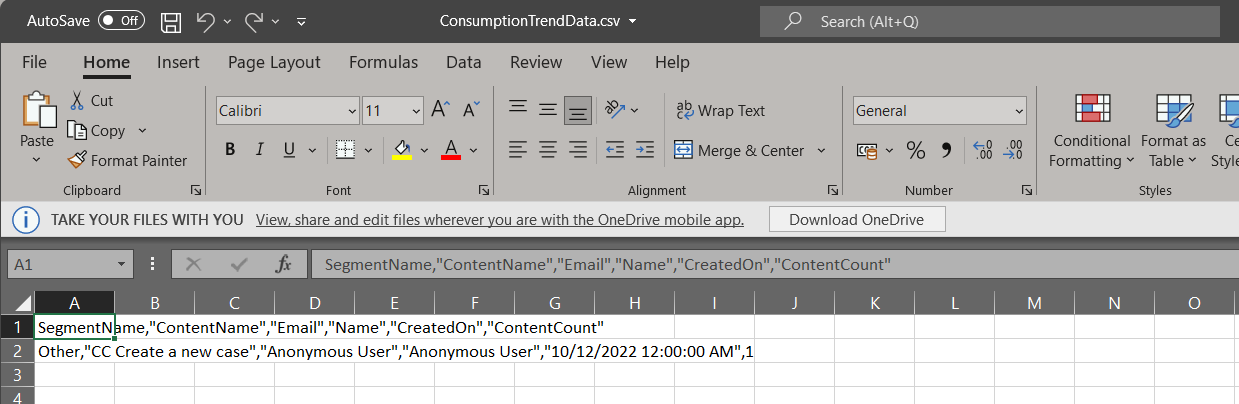
Content consumption csv sample:
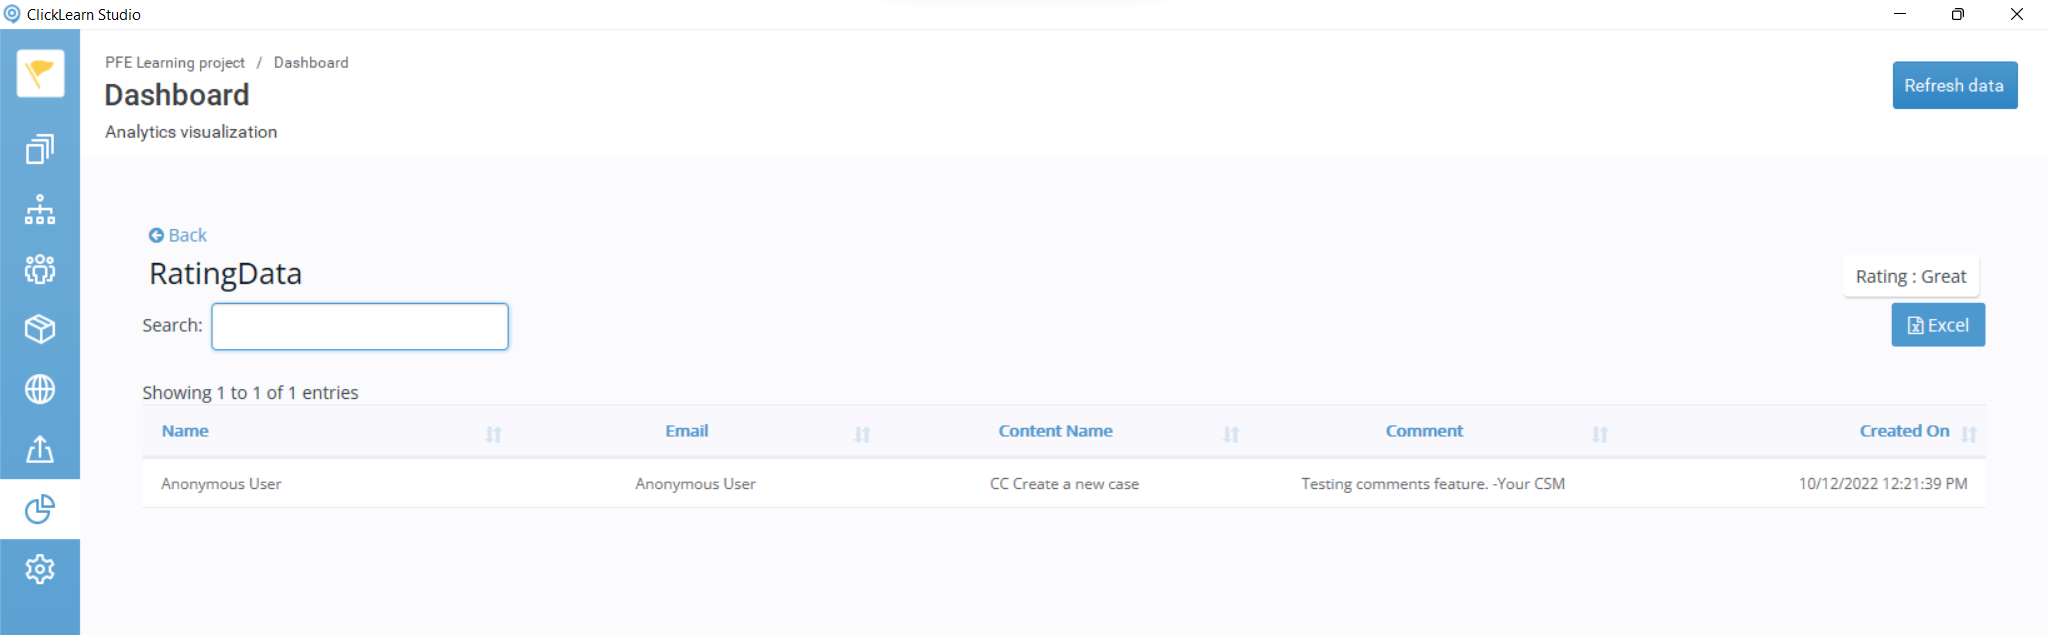
Rating details with comments (if any were submitted):
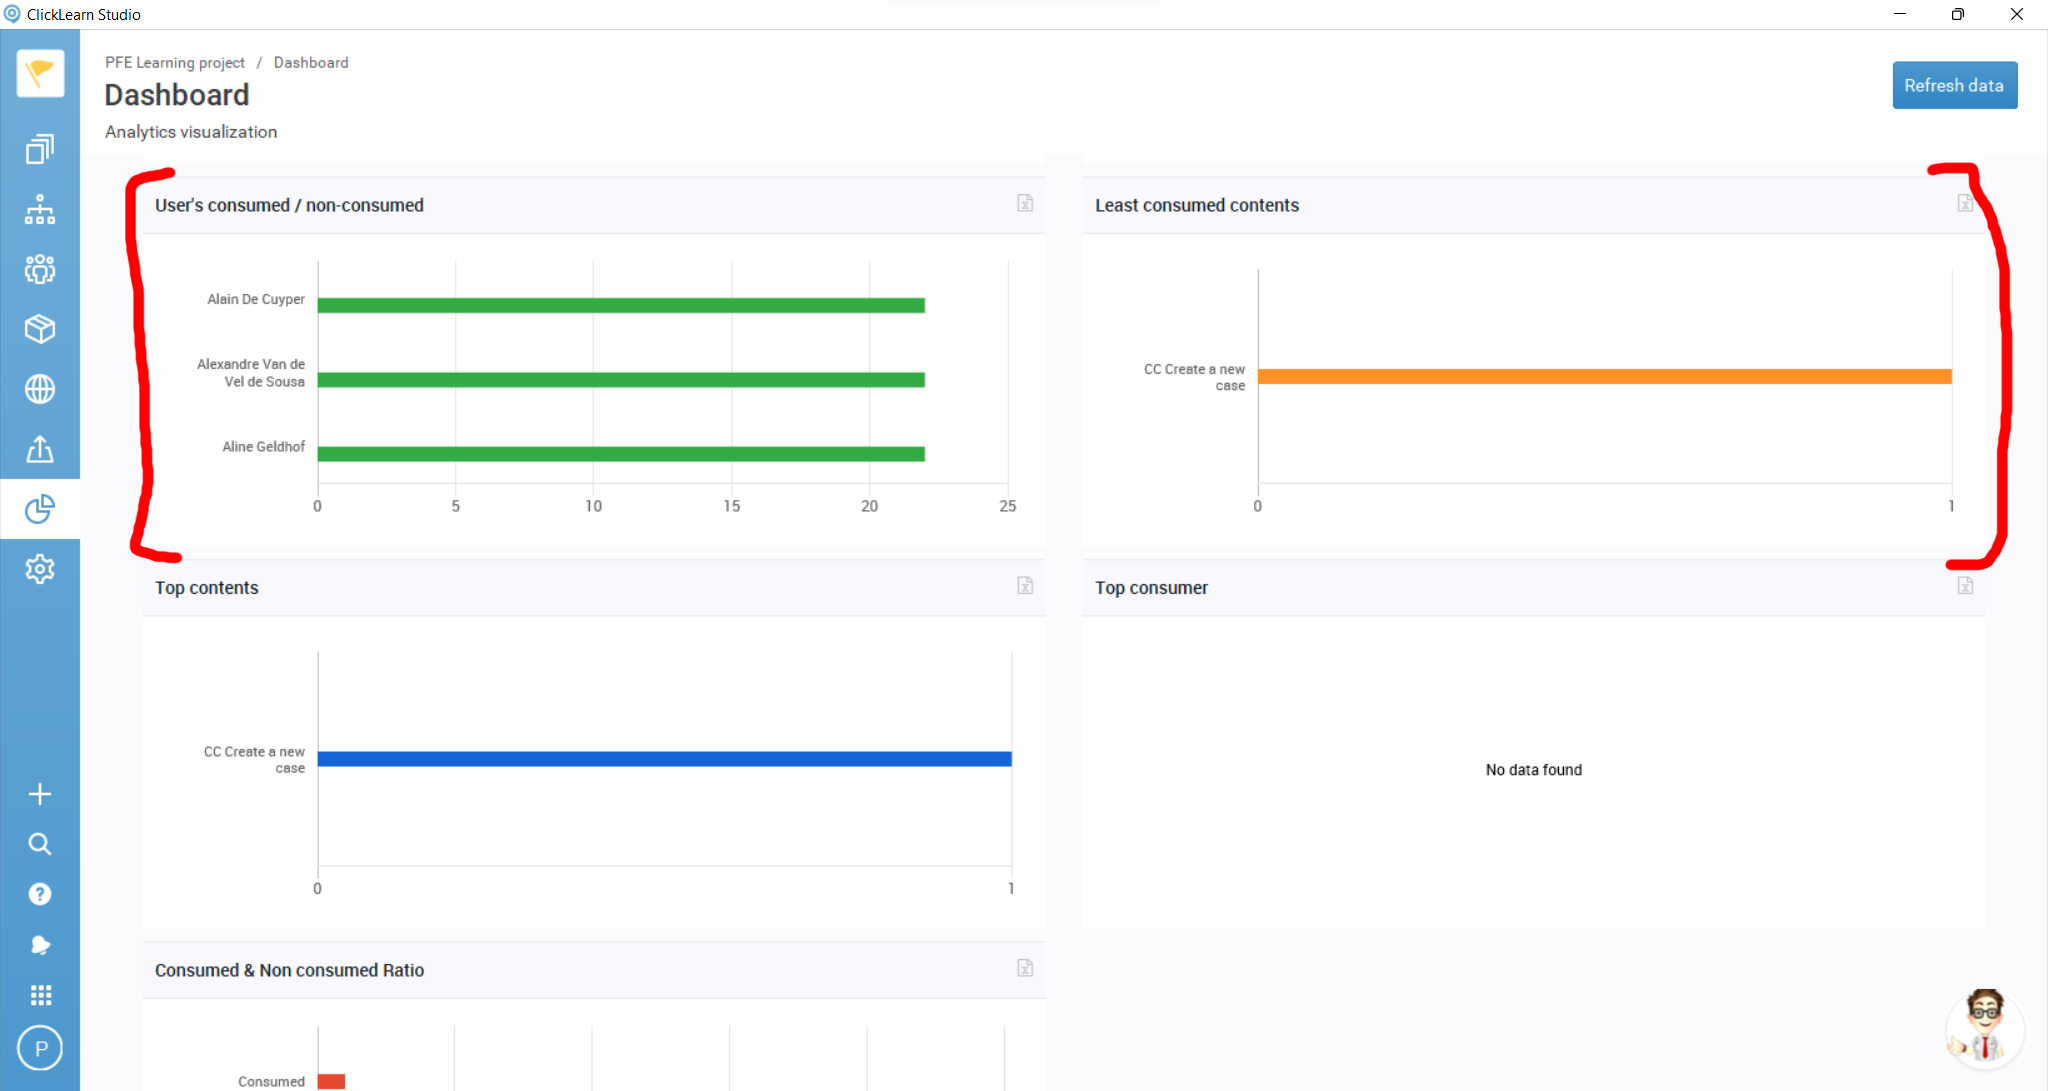
User’s consumed / non consumed & Least consumed contents
Click on a bar to see details.
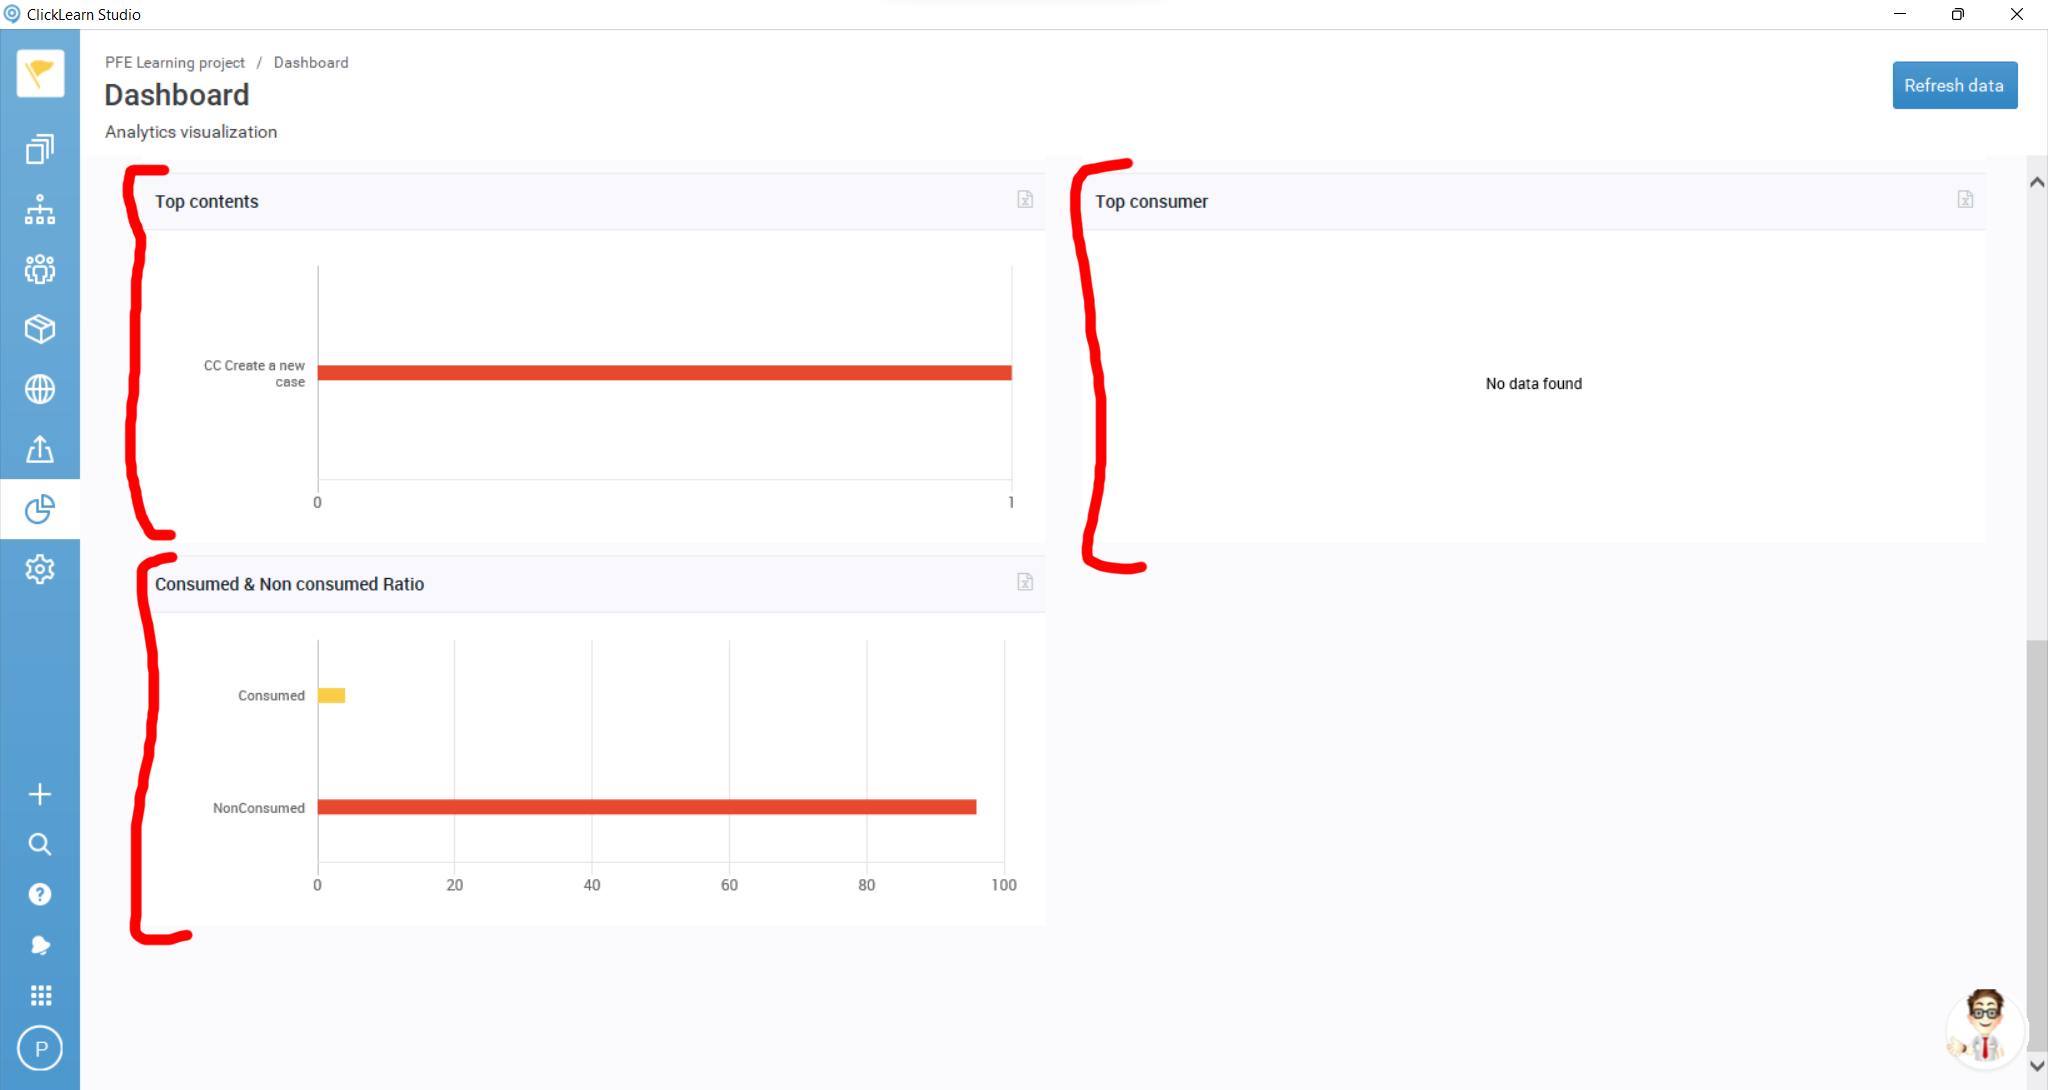
Top contents, Top consumer & Consumed & non-consumed ratio
Click on a bar to see details.
Custom reports using Microsoft Excel
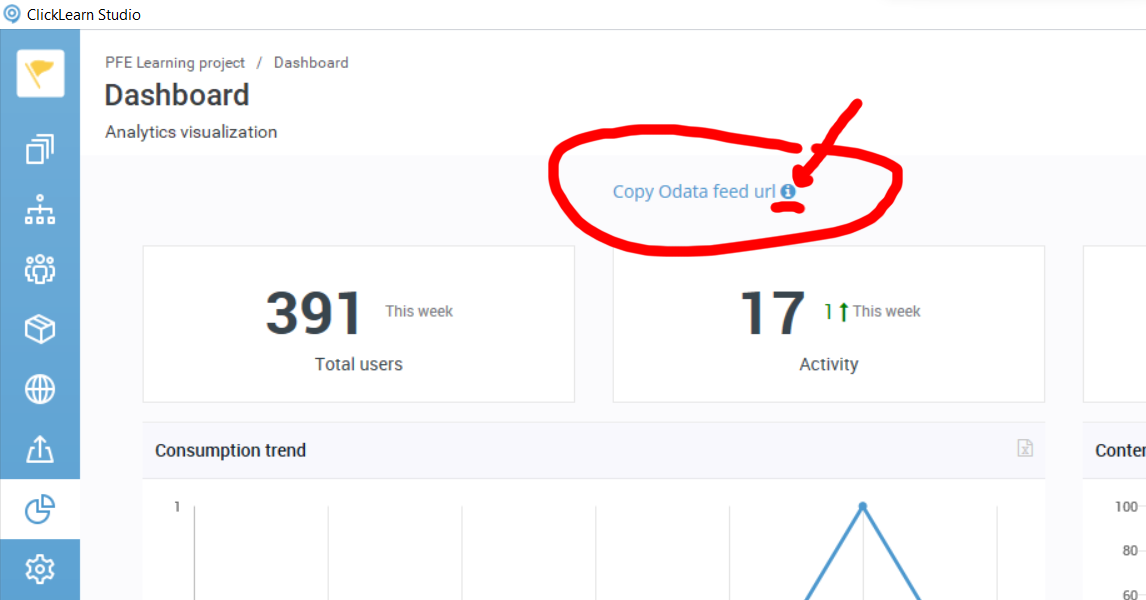
If you are interested in designing your own reports, ClickLearn Attain supports using Microsoft Excel to use your data in reports and dashboard you can design at your own leisure. Go to the top of Dashboard page and click on “I” icon next to “Copy Odata feed url”, and follow the instructions to get started.
You need Microsoft Excel installed on your computer to use this method.